Trade Calculator App
Overall Description
The Trade Calculator App takes input from 6 different trade charts and generates a graphic that shows the value each chart places upon each pick in the trade, along with totals for each team, and a positive or negative surplus value for the trade down team.

As you can see from the image above, the Chiefs traded up with Buffalo for the 10th overall pick (they selected Patrick Mahomes with it). They gave up the 27th and 91st picks in 2017, and the 22nd pick in 2018 for the 10th pick.
The “Point Diff” row in the “Excess Value” section shows the difference between the total value for the first team, and the total value for the second team. Those numbers can be hard to translate, so I also added an “Excess Pick” row that converts those numbers into a pick range (early, mid, late) and round. The excess value for this trade ranges from a late first round pick to an early third round pick, depending on the chart.
App Inputs
Let’s use the Eagles trade up for Jalen Carter in the 2023 NFL draft as an example for how to use this app. You can see the inputs in the left hand sidebar in the image below for this trade.
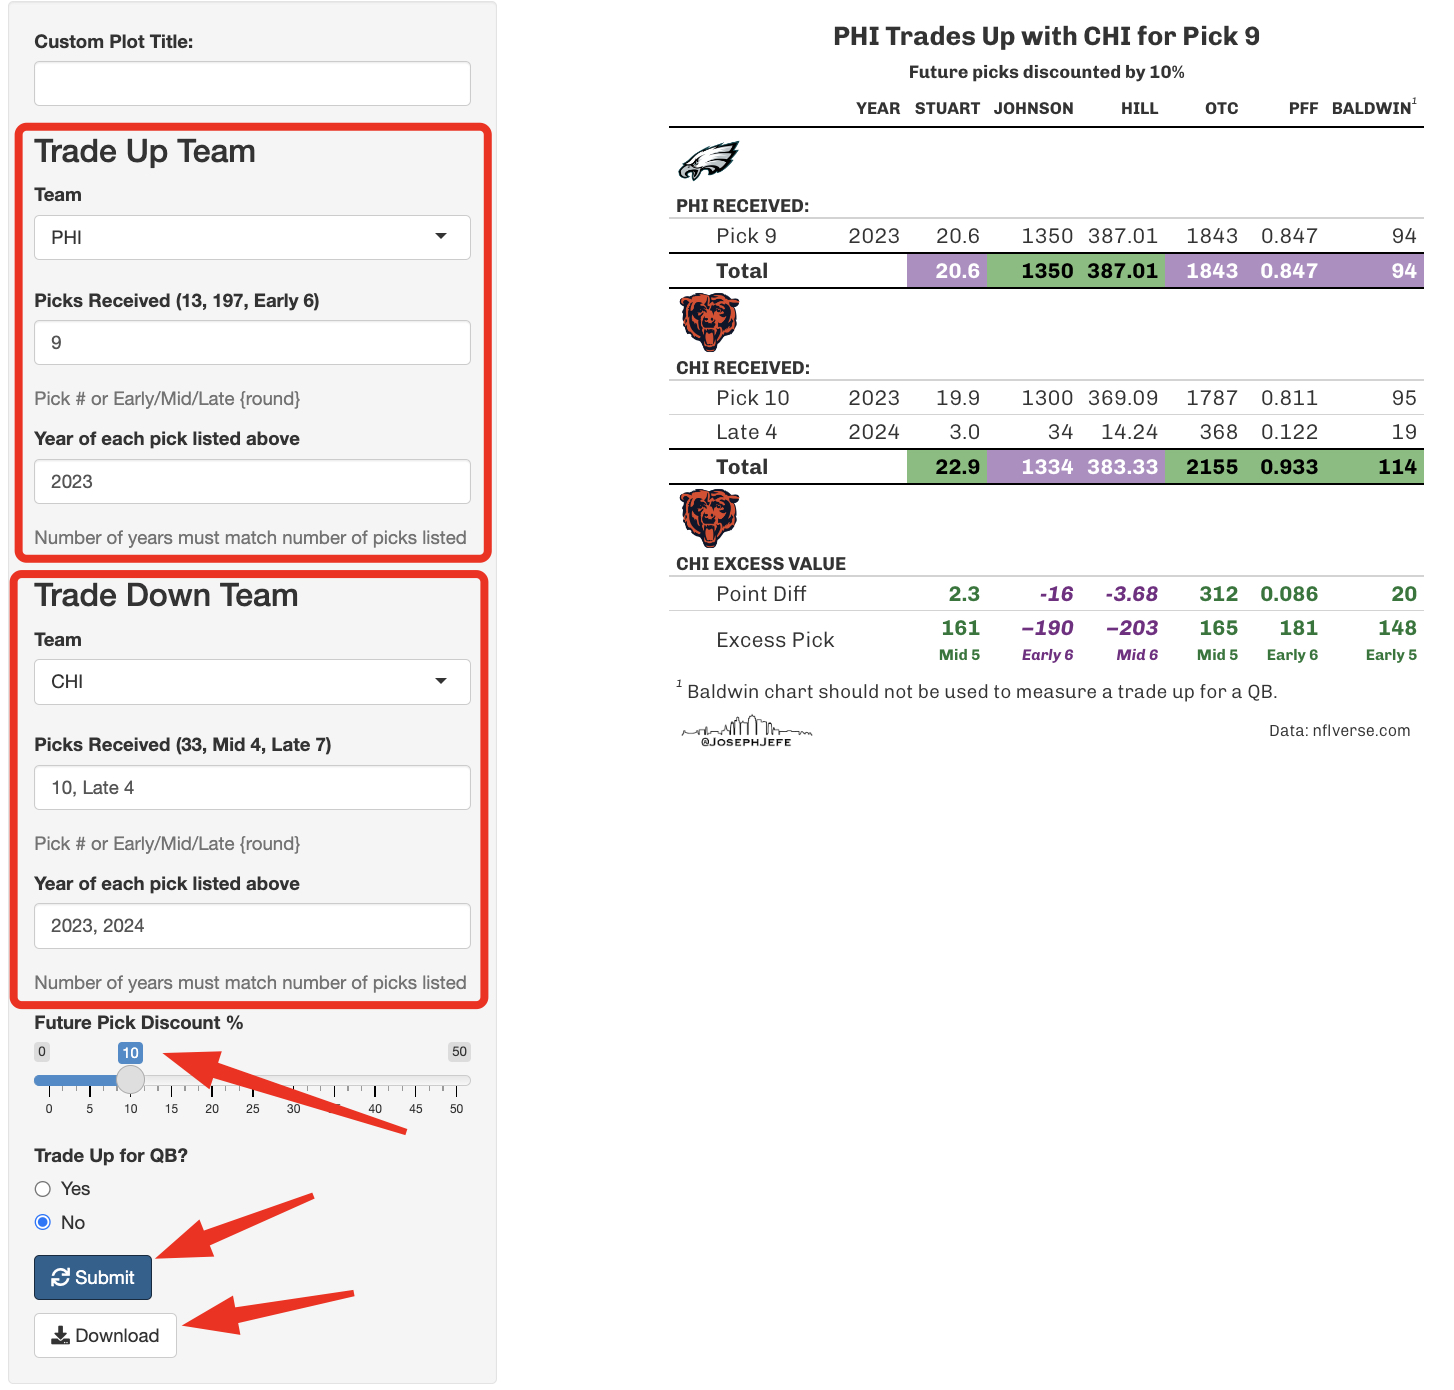
First start by inputing the team that is trading up (ie. trading for the highest pick in the current year). That would be the Eagles. They traded up for the 9th overall pick in 2023. So we select PHI as the Team, 9 as the Picks, and 2023 as the year.
Next, we input the trade down team. That is Chicago. They traded down for pick 10 in 2023, and a 4th round pick in 2024. We select CHI as the team. For the picks, since there are multiple picks involved, they must be comma separated. Additionally, one of the picks is a future pick, and we don’t know the actual pick number yet, just the round. For unknown pick numbers, we can estimate whether we think the pick will be an early, mid or late pick in the 4th round. The Eagles were in the 2023 Super Bowl, so they will likely still be a good team in 2024. That means their 4th round pick will likely be a late pick in the 4th. So the whole input for this is “9, Late 4”.
We also need to list the years for each pick listed. The 9th is a 2023 pick, and the late 4th is a 2024 pick. So we will input “2023, 2024”. Note that you must list a year for every pick, even if there are multiple picks in a single year (so the Mahomes trade, where the Chiefs traded 27 and 91 from 2017, and 22 from 2018 would have a year input like this: 2017, 2017, 2018)
Once you have input the teams, picks, and years for both the trade up and trade down teams, click the “Submit” button, and the graphic will generate for you. You can download the graphic as a .png file with the download button at the very bottom.
You can optionally change the amount that future picks should be discounted. The default is 10%, but you can change that if you wish. You can also add a custom plot title. Scroll to the very top of the sidebar and type out what you want the plot to show as the title instead of the standard “PHI Trades Up with CHI for Pick 9”.