Team Formations App
Overall Description
The Team Formations Shiny App allows you to see the offensive or defensive formations that a specific team was in, either for a specific game, or across a range of games in a season. It can also show you the offensive or defensive formations that a specific team has faced over the course of a selected range of games.
Offensive and Defensive Formations
Offensive formations are listed as a set of three numbers, such as 1-1-3. Those numbers correspond to the number of Running Backs, Tight Ends, and Wide Receivers on the field for a given snap. So a 1-1-3 formation would have one running back, one tight end, and three wide receivers. Each formation assumes that there are 5 or more offensive linemen, and one or more quarterbacks, on the field for every snap. For most plays, that leaves 5 skill positions (RB/TE/WR), and those are the positions listed. If the numbers in the formation add up to less than 5, then there was an extra offensive lineman or extra QB (see: NO and Taysom Hill) on the field for that snap.
Defensive formations follow the same format, but go left to right from Defensive Line, Linebackers, and Defensive Backs. A common formation would be a 4-2-5, which would be four defensive linemen, two linebackers, and five defensive backs. Note that sometimes players who play on the defensive line as pass rushers are listed as linebackers (for example, Carlos Dunlap for KC in 2022), so these formations can occasionally be misleading. This can also happen occasionally with safeties and linebackers.
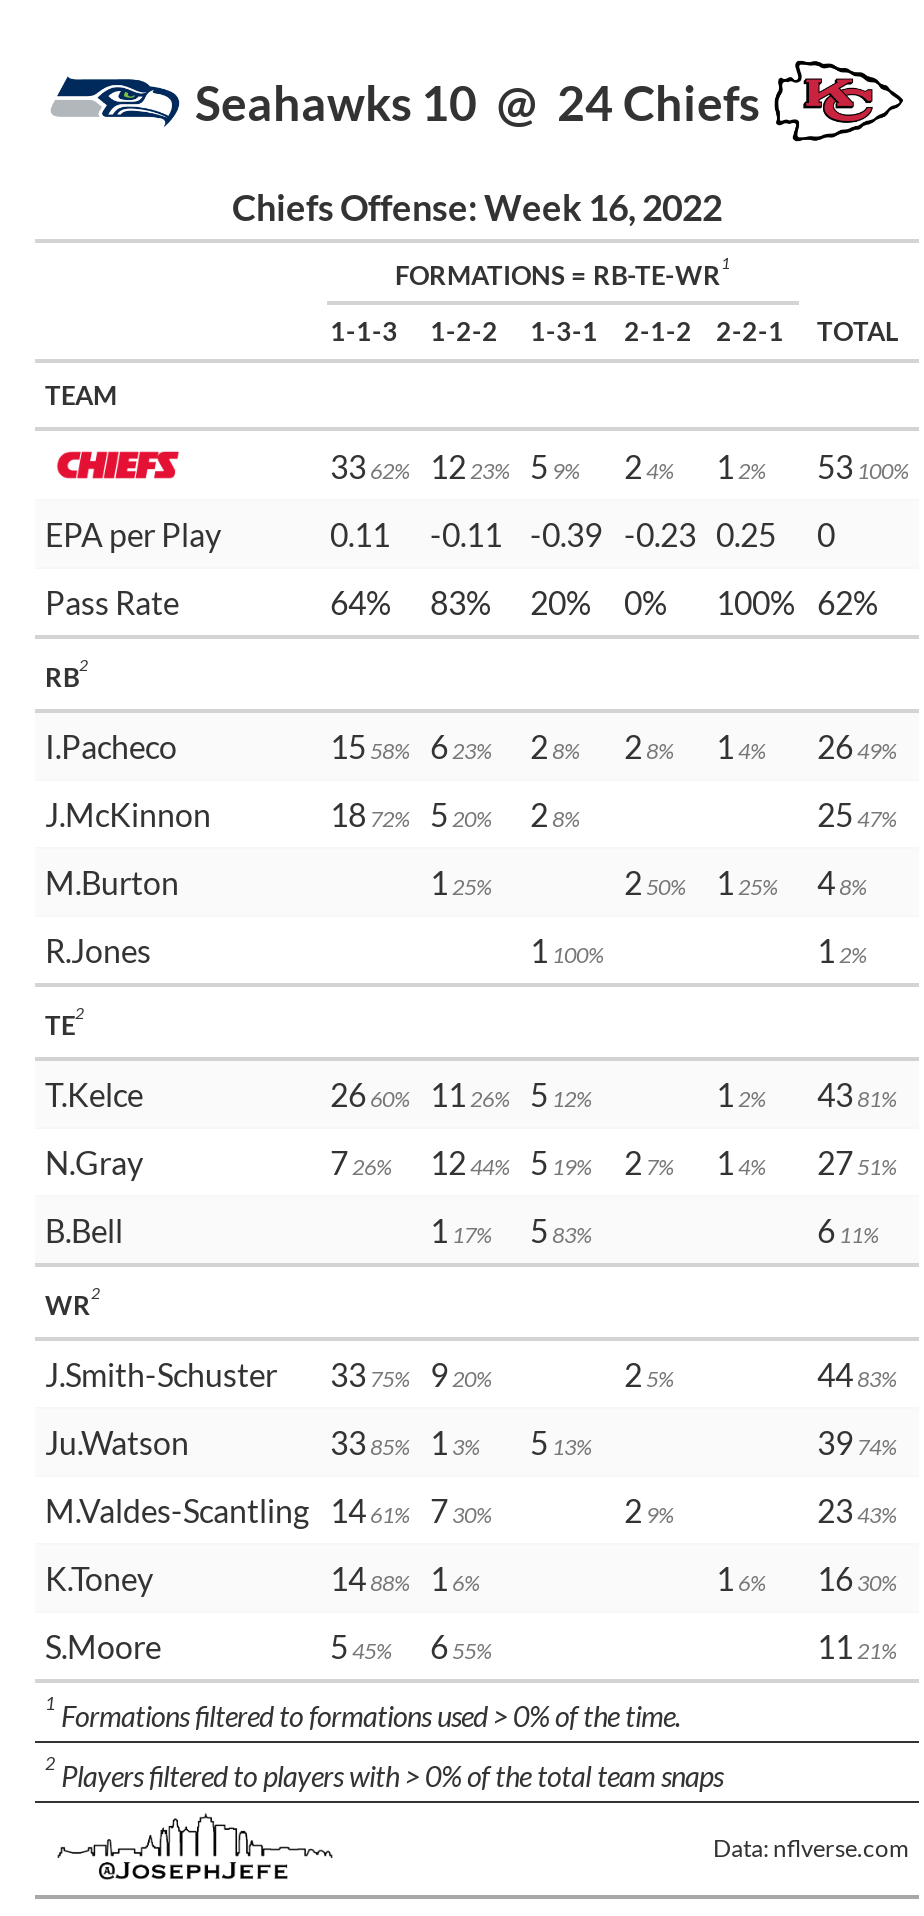
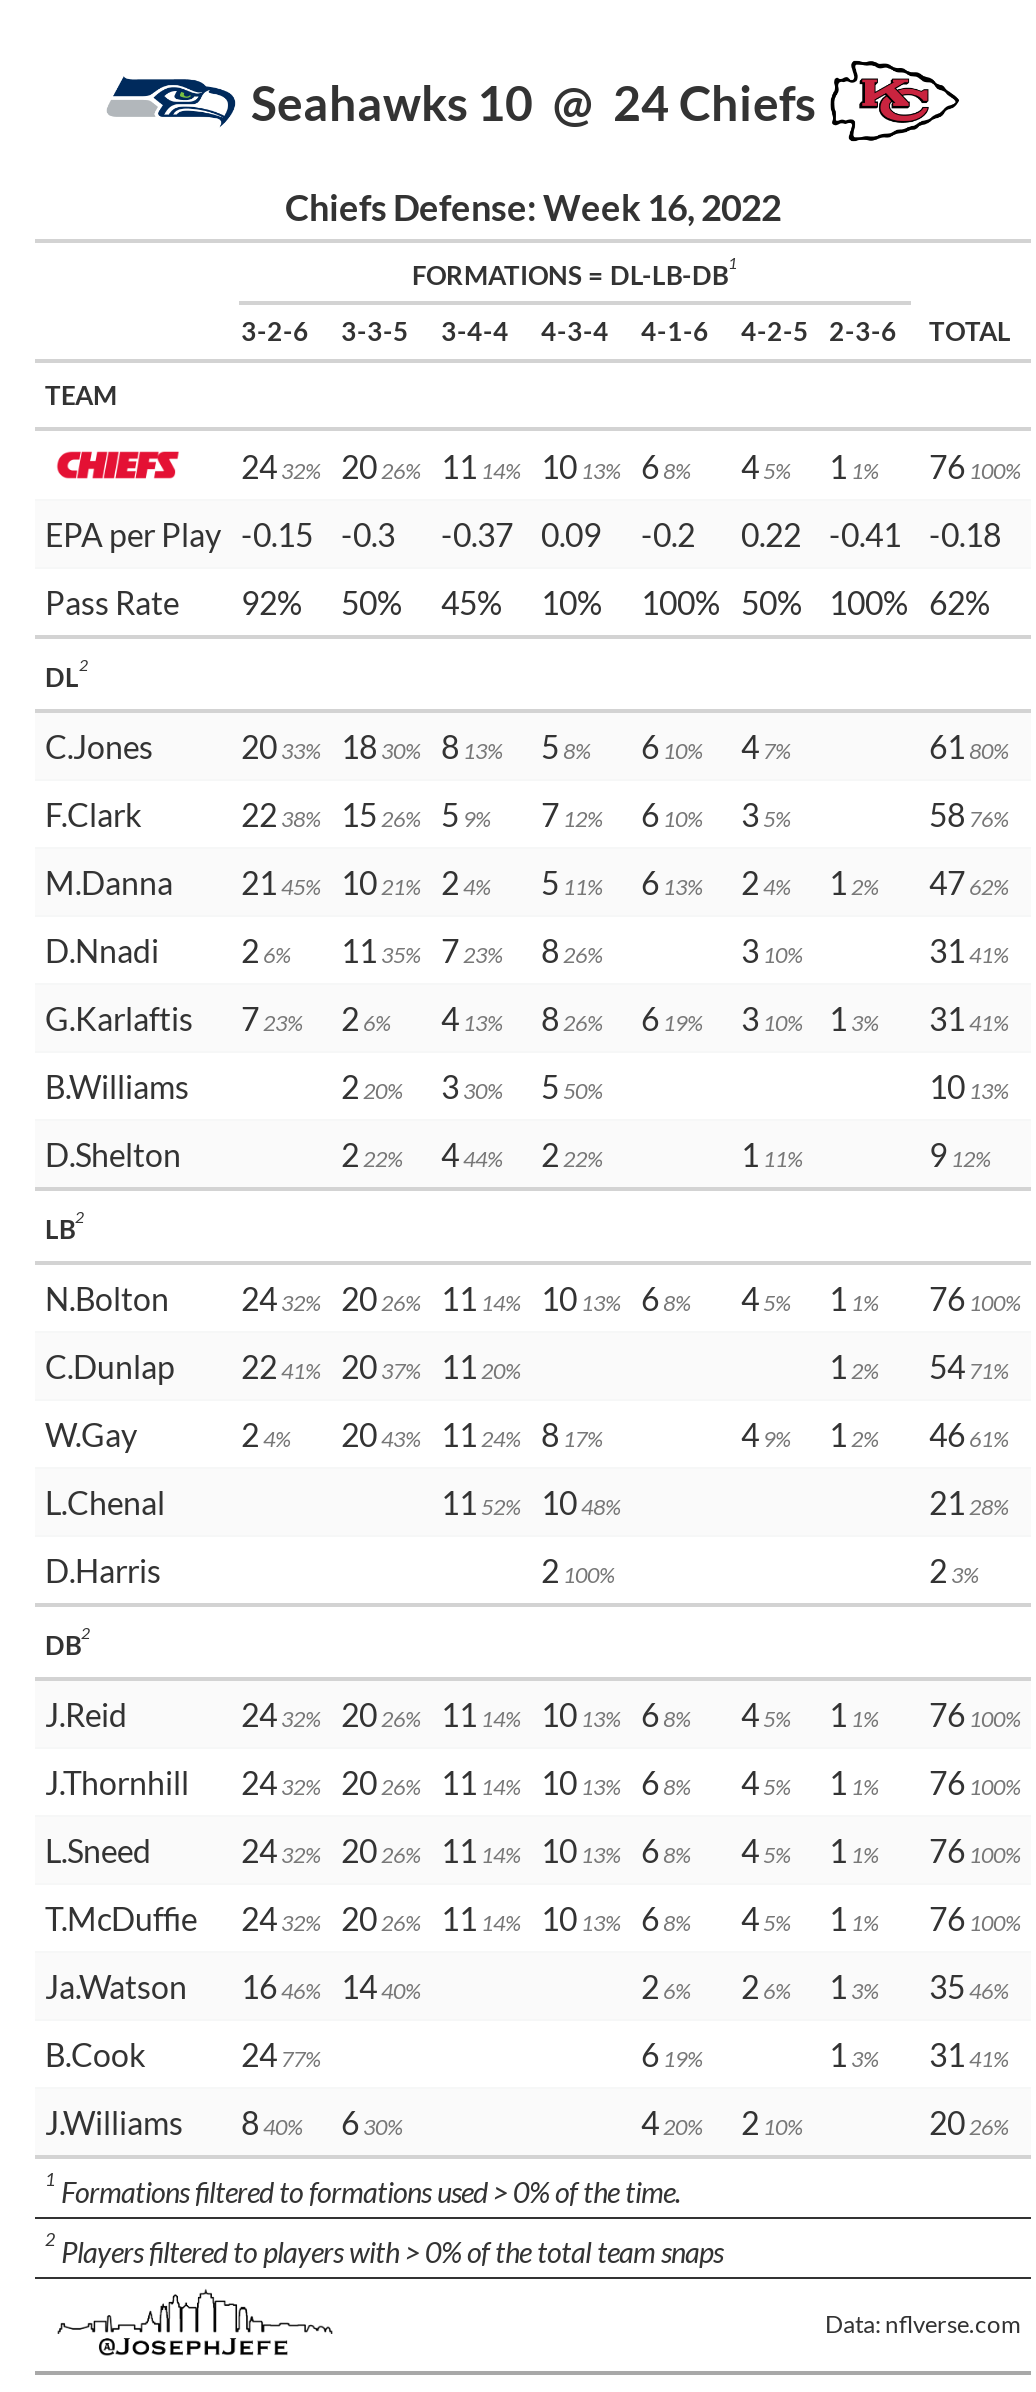
Starting at the top of these graphics, you can see that this is for a single game. Seahawks @ Chiefs. Chiefs won the game, 24-10. It was Week 16. The first graphic shows the Chiefs offensive formations, the second shows the Chiefs defensive formations. The Chiefs offense used 5 different formations in this game, thought the vast majority of it was spent in 11 personnel (1-1-3) or 12 personnel (1-2-2).
The first block shows team statistics. The top row shows the number of snaps that were taken in each formation, as well as the percentage of snaps for each formation. Next it shows the EPA per play in each formation, as well as the overall EPA per play for the entire game, regardless of formation. Note that EPA is a stat that shows offensive efficiency, so a high EPA/play is good for an offense, while a low EPA/play is good for the defense. Finally, it shows the pass rate in each formation, as well as the overall pass rate.
The rest of the blocks are separated out into the player positions (RB, TE, WR for offense, and DL, LB, and DB for defense). It shows every player who took a snap in the game, and how many snaps they took in each formation. The percentage next to the snap number is the percentage of that specific players total snaps that were taken in that formation. For example, I.Pacheco was in for 29 total snaps (49% of the Chiefs offensive snaps). He took 58% of those 29 snaps in 1-1-3 formation, 23% in 1-2-2 formation, and the remaining 19% of snaps in the other three formations the Chiefs were in.
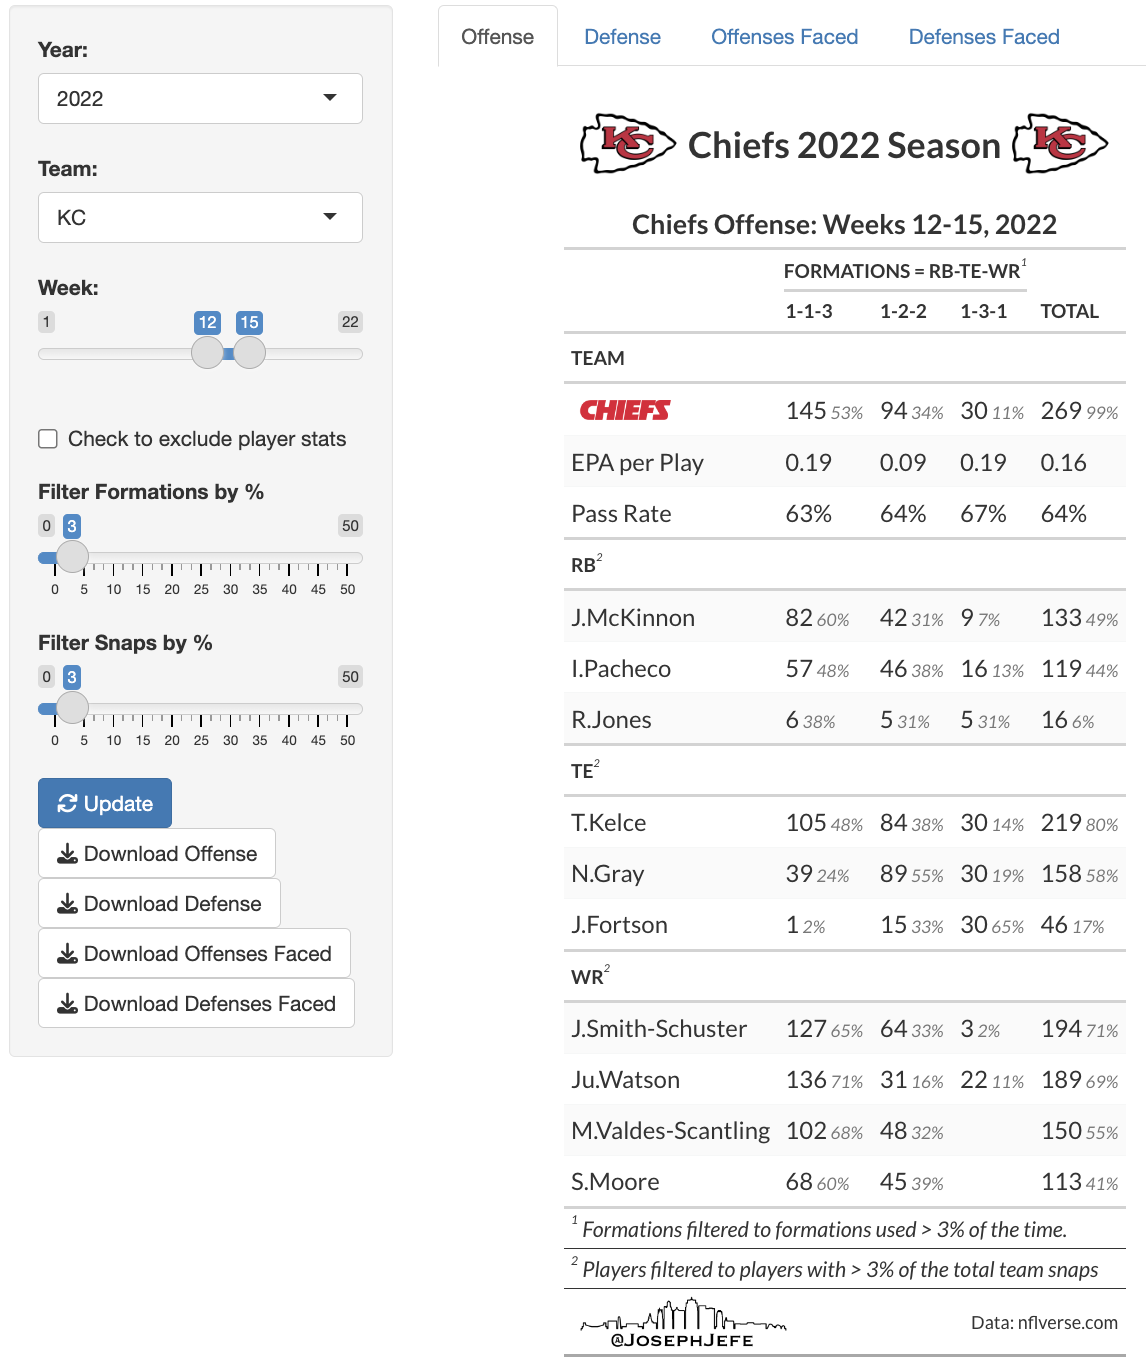
When you are in the app, you can change the game or range of games that is being shown by using the side panel. Going from top to bottom on the side panel (shown below), you can change the year, the team, the week or week range. You can check a box to exclude player stats, so that only the team block shows up on the graphic. You can filter out formations that were used less than “x” percentage of the time, and same for players with a smaller snap percentage than “x”. The filtered percentages will show up on the bottom of the graphic in the footnotes.
Once you have made changes to the left hand sidebar, click the blue “Update” button, and an updated graphic will appear with your filters and selections. Shown below is the Chiefs, weeks 12-15, formations and players filtered to only show those with more than 3% of the overall snap percentage for those 4 weeks. Note below that the header has changed on the graphic. When showing just one game, the opponent and game score will show. When showing a range of games, it switches to just the team logo, and the title text changes to show that it is a season long (or range within season) graphic. Finally, underneath the blue “Update” button, you can see four download buttons. Use these to download a .png image of the graphics.
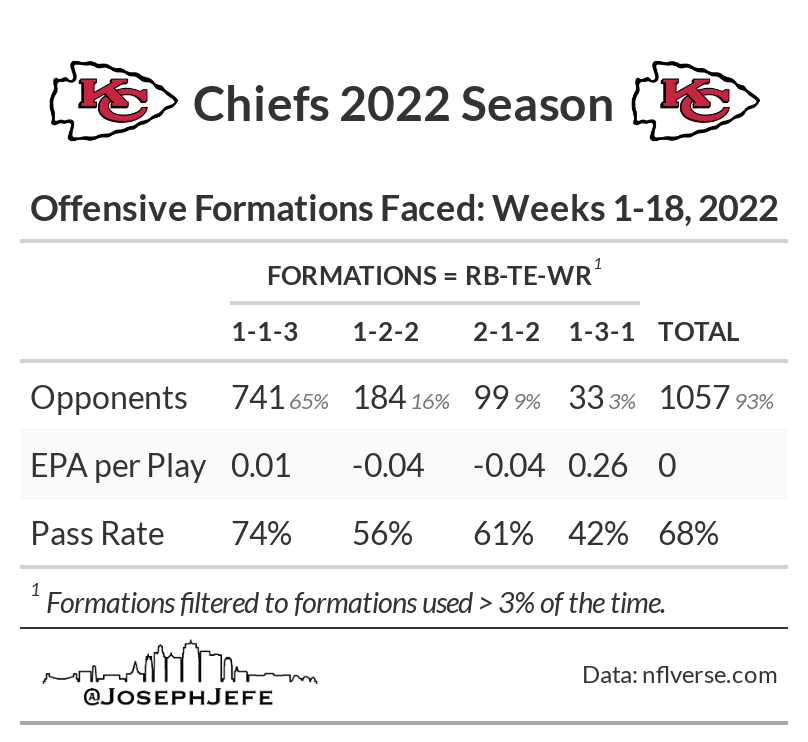
Offenses and Defenses Faced
You can also create a graphic that shows what offensive or defensive formations a given teams opponents have used against them. These follow the same format as the above graphics, but note that all of the stats are now referencing the combined opponents of the selected team. That means that when looking at the offenses faced, a high EPA/play means those offenses performed well against the selected team. Conversely, when looking at the defenses faced, a low EPA/play means that the selected teams offense did not perform well against those defenses.